


5 Billion Years of Life on Earth
- Aug 1, 2017
- 3 min read
This post is largely just a graphic, or page if you will, of the major forces that shaped life on earth today. It covers the very beginning of Earth's formation until today, the major life species trends and Geologic Eras that have all conspired to me writing this out on this little blog article.
So, setting this up...
I arranged Dr. Ann Purdy to come to a meeting that I arranged for a club I currently help out with their general meeting nights. We cover all sorts of topics that are related to Minerals, Gemstones, Fossils, Geology, Paleontology and more. She gave a great talk titled "A Brief History of Life". It was interesting to me because I had never heard the summation of the planet's geologic time and life tied together so nicely and in an manner that was very easy to follow. It made me realize that a huge number of events and variables all conspired to us sitting together and talking about what had happened and how we got here. It was kind of like the Universe was understanding itself. Perhaps that's what our purpose is?
Anyway, she had many slides and pictures of Earth in the distant past with the plate tectonics and continents in very different positions. We got to see them move about and slowly come together and split apart until we got to where we are today. This one one of the three major themes of her talk.
The second theme was about how life evolved and adapted to the many space and places that it could find to survive and how complexity grew upon itself over billions of years until land and water were filled with many creatures and plants. Time, and time again, events took place that caused great catastrophes to life, but it always adapted and evolved to come back stronger than before and better equipped to survive in the new conditions that it was living within.
The third major theme was the environment and how it changed, affecting life and climate. The interaction between the oceans, mountain ranges, land configuration and the atmosphere all work together to create conditions that are favorable or unfavorable to life. Rarely, we get hit from something outside our little blue planet that also contributes to what happens. Quite oddly, it usually takes several major disruption events to happen all together to cause life enough grief that it has to change its direction.
I thought to myself, you should do a summation of this story all on one page. I thought it would be an interesting challenge and embarked on many weeks of research to come up with the data and multiple perspectives on the three major themes over Earth's lifespan so far. It was fun, interesting and will springboard into some more blog posts later on.
Earth reduced to one page: (click to enlarge)
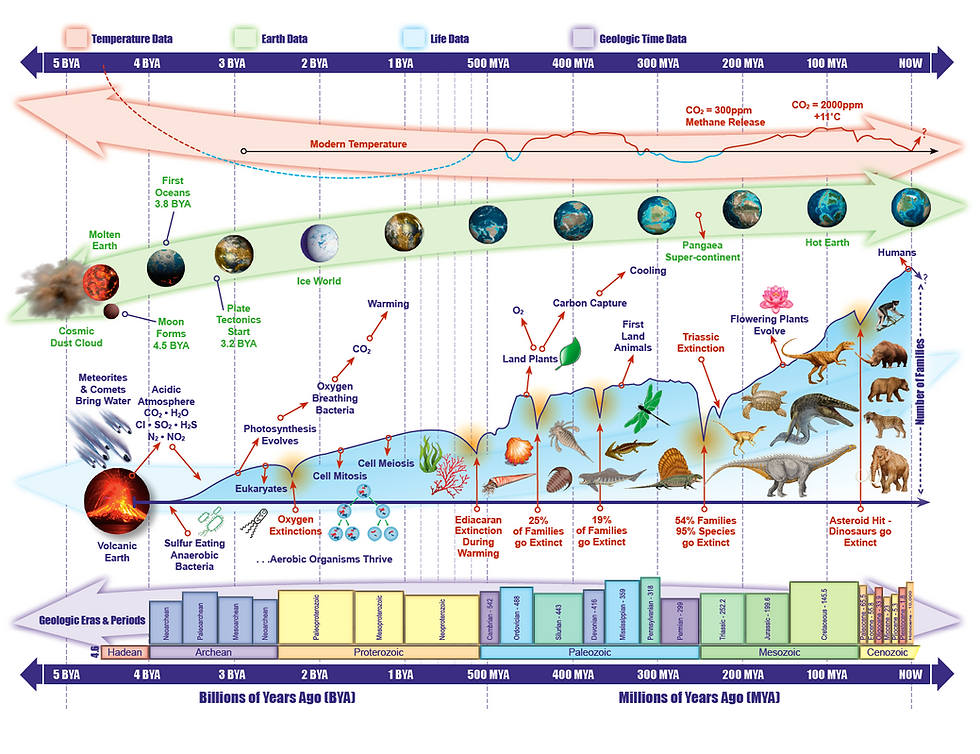
There are four lines or arrows that follow how the page is segmented out. The red arrow shows the average global temperature based on the best research available today. The green arrow show a small thumbnail of how Earth looked (without clouds mostly) at that time in the past. A kind of continental configuration in a half sphere. The light blue arrow is the line of life. It shows the number of families that lived during that time in Earth's history based on fossil evidence that we have gathered from all over the world. Within the graph of the living families are examples of the types of animals that lived during that time (selected representative species) and highlights of the major extinction events that took place. Many species died out from environmental change as they could not react quickly enough to avoid extinction (as far as we know). And finally the purple line shows the largely agreed on names of the geologic periods/eras that much of this information is broken into for timeline purposes. Note that the first part (left side) of the page is roughly 4.5 billion years and the right half is the last 500 million years.
Finally, if you wish to have a high resolution PDF file of the page, you can find it here.
Sources: Wikipedia on many of the images, and some general google image searches. Scientific data on climate conditions, number of species, geologic time scales, and plate tectonics came from multiple sources. In some cases, the sources varied slightly from one another and I averaged them to create an acceptable rendition of the multiple data points. Mr. Google offered invaluable advice on collecting the visual data in order to create this and I am very certain that we are still learning about the distant past and it could change this page, as science rarely is perfect, but its the best tool we have so far.
Comments